Watch for a breakout
A breakout means price moves beyond a recent high or low. The method watches for that move as a possible start of a trend.
The Turtle Trading Method brought a disciplined approach to following trends. Our TradingView indicator makes those ideas easier to use: clear BUY and SELL signals, defined risk, and a plan for each trade.
Signals are educational market information. Trading involves substantial risk.
A buy or sell signal is only the beginning. The indicator shows the direction, entry, stop, and target so you can understand the plan at a glance. You make your own trading decision.
A breakout means price moves beyond a recent high or low. The method watches for that move as a possible start of a trend.
A BUY or SELL label marks the breakout. Premium also lets you create a TradingView alert for that signal.
A stop marks the point where the idea may be wrong. The target defines the planned reward. Clear WIN / LOSS markers show how a completed signal ended.
Designed for your TradingView chart: a readable entry signal, defined risk, and an uncluttered view of each trade.
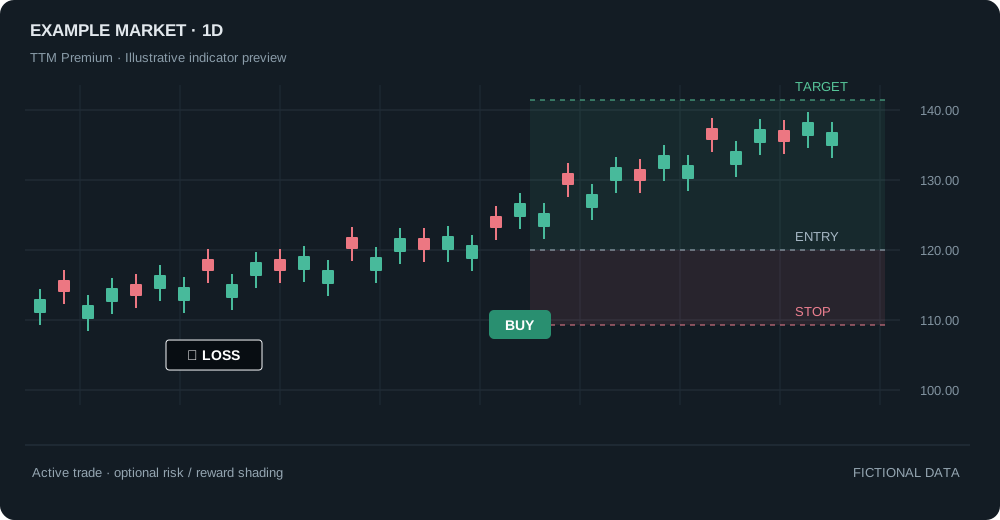
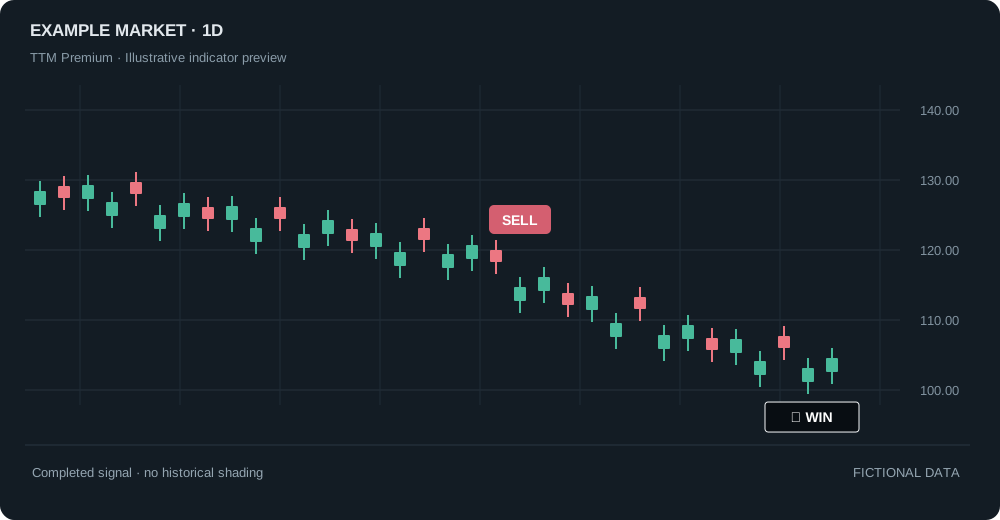
Illustrative interface previews using fictional candles and outcomes. These are not TradingView screenshots, live signals, or a performance record.
One experiment turned a simple set of rules into trading history.

Richard Dennis believed trading could be taught. His partner, William Eckhardt, thought natural ability mattered more. To test the idea, they recruited people from varied backgrounds, brought them to Chicago, and taught them a defined set of trading rules.
The trainees became known as the “Turtles.” After a short training period, they traded real accounts using a complete system: which markets to trade, when to enter, how much to risk, and when to get out. The name came from Dennis’s comparison to raising turtles in Singapore.
The lesson for a beginner is surprisingly practical: you do not need to predict where a market will go. You need a rule for entering, a limit on risk, and a rule for leaving. Many breakouts will fail; the aim is to manage those losses and stay with a trend when it lasts. That is the philosophy behind our indicator: make a disciplined process easier to follow.
Entry signals make headlines. Position sizing, exits, and the discipline to take the next valid trade are what make a system complete.
Historical account and original rules: Curtis Faith, The Original Turtle Trading Rules. Historical results do not predict future returns.
The indicator helps you understand a trade on one chart. The planned screener brings a watchlist into one view, helping you spot markets breaking out—or getting close—without opening every chart individually.
Review BUY, SELL, near-breakout and neutral states across the covered watchlist.
Planned distance-to-breakout and volatility context help you decide which charts deserve a closer look.
Use the screener to find candidates, then review the indicator’s entry, risk and exit levels on TradingView.
Screener access is not open yet. Supported markets, timeframes, refresh frequency and plan availability will be confirmed before release.
| Market | Setup | To breakout |
|---|---|---|
| Example A | BUY | Triggered |
| Example B | SELL | Triggered |
| Example C | Near BUY | 0.7% |
| Example D | Neutral | 3.2% |
Fictional examples showing the planned format. No live market data or screener access is provided.
The original Turtles looked for price to break above or below the prior 20 or 55 days. They used market volatility to size positions and shorter price channels to exit. Our indicator adapts those principles with configurable breakout, ATR-based stop, and reward-to-risk settings. It is an adaptation of the method, rather than a reproduction of the complete original system. Supported markets and final settings will be published before subscriptions open.
Read the original rulesHistorical charts keep clear BUY / SELL signals and WIN / LOSS outcomes. Optional risk and reward shading appears only for the active trade, so completed trades do not cover your chart. This fictional example explains the levels.
Prices shown are invented to demonstrate alert structure. Any future signal may differ based on the published methodology and market data.
Standard keeps the rules on your chart. Premium adds TradingView BUY/SELL alerts so you can step away from the screen.
For traders who prefer to review their charts.
Monthly subscription · monthly price pending
View member portalFollow the rules without watching every candle.
Monthly subscription · monthly price pending
View member portal| Feature | Standard | Premium |
|---|---|---|
| TradingView indicator | Included | Included |
| BUY / SELL chart signals | Included | Included |
| Clear WIN / LOSS markers | Included | Included |
| Entry, stop and target levels | Included | Included |
| Optional active-trade shading only | Included | Included |
| TradingView BUY / SELL alerts | Not included | Included |
| Self-service billing and cancellation | At launch | At launch |
Subscriptions are not open yet. Final pricing and supported markets will be published before enrollment. TradingView alerts require the Premium script and setup in your own TradingView account.
Trading securities, futures, or other markets can result in significant losses, including losses greater than an initial investment when leverage is used. Trend-following strategies can have prolonged drawdowns and frequent false breakouts. Signals are general educational information, not personalized investment advice. No performance record or profitability claim is presented here. Independent execution, position sizing, and suitability decisions remain with the trader.
Turtle Trading Method is an independent indicator inspired by publicly described Turtle Trading rules and is not affiliated with the original Turtle traders.